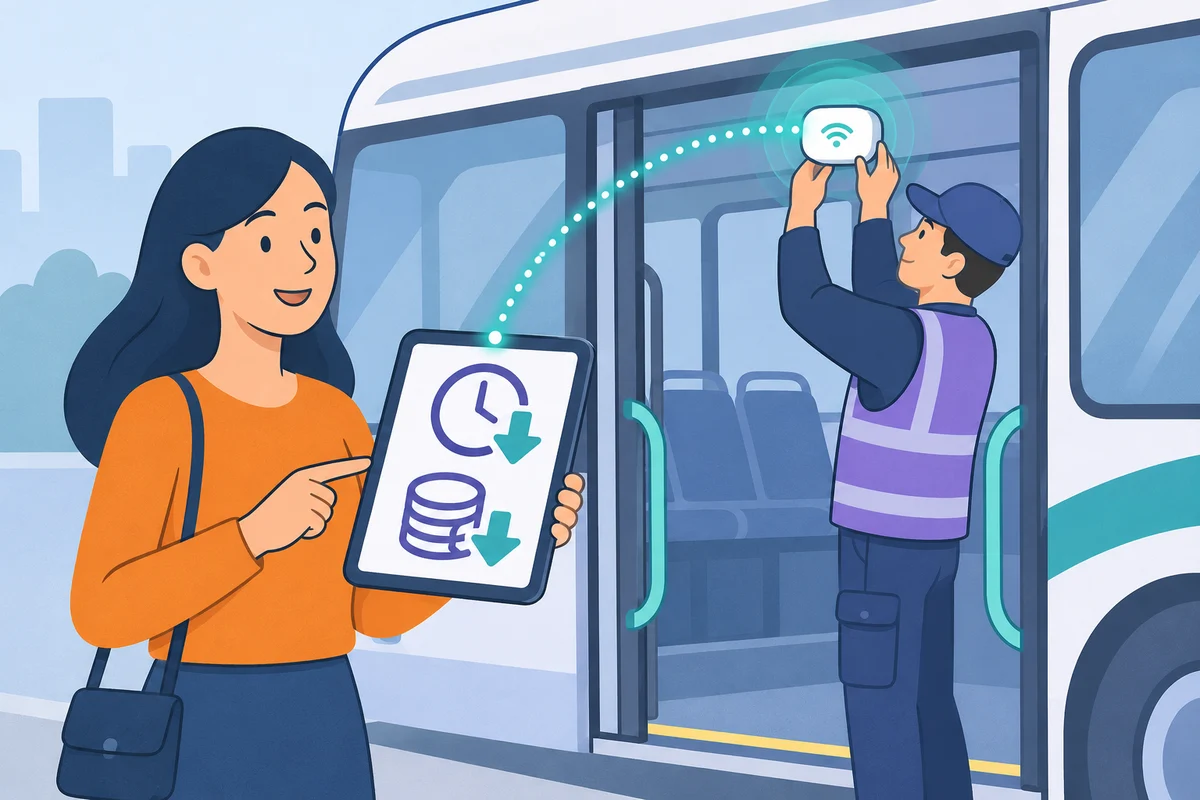
Optimize supply and revenue
Reveal unserved connections, improve transfers and align supply with actual transport demand.

Plan the service
Counting tells you how many. Flowy tells you from where to where. Reconstruct anonymous origin–destination flows between stops, neighbourhoods and cities. Link boardings, alightings and onboard loads to the correct service and plan your offer around actual demand.
Value for the operator
Reveal unserved connections, improve transfers and align supply with actual transport demand.
Flowy reduces installation time and costs through innovative technology that requires only one sensor per carriage or bus, cutting retrofit costs by up to 90%.
Flowy integrates service data and passenger flows in real time through GTFS-RT, sensors and proprietary algorithms, to optimize operations and services while fully respecting privacy.
Three situations, three service decisions
Split a route, improve connections to a major destination or adjust weekend services: see how Flowy’s O-D analysis supports practical decisions.
01A route that can be split
A route passes through an interchange, but many passengers only travel on one of its two sections. Running the full route every time can generate mileage that does little to meet actual demand.
Flowy reconstructs connections between stops and makes flows on either side of the interchange clear. The O-D matrix helps you see how many journeys stay within each section and how many continue beyond the interchange.
Consider splitting the route at the interchange, with coordinated connections.
Reduce unproductive mileage and reallocate services where there is demand.
DESTINATION →
02High-demand destinations
A university campus, hospital or major transport hub attracts passengers from different stops. Regular services make many stops, even for passengers heading to the same destination.
Flowy highlights the destinations attracting the most journeys and the origins feeding them. Read the concentration of flows in the matrix to identify connections where a more direct service could be considered.
Introduce express services to major destinations during periods of demand.
Offer shorter travel times on the most popular connections.
DESTINATION →
03Weekdays vs weekends
Weekday travel is dominated by work and education. Destinations and timings change at weekends: keeping the same service pattern can leave some journeys empty and others under pressure.
With data available 24/7, Flowy lets you compare origin–destination journeys on weekdays and weekends. This comparison reveals how connections change and helps you assess demand alongside boardings, alightings and onboard loads.
Adapt frequencies and capacity to weekday and weekend travel patterns.
Match services to demand across the days and times of the week.
DESTINATION →
Illustrative situations and matrices, without real data. Service decisions should be assessed against measured demand and the network’s operating context.
From passenger flows to operations
Let demand guide better service planning.
Passenger flows reconstructed through the O-D matrix help public transport operators plan journeys, frequencies and capacity. Historical data for each service, linked to vehicle status through standards such as GTFS-RT, helps optimise resources and improve the passenger experience.
Location completes the operational picture: when GPS data is incomplete or missing, Flowy can use data from its own sensors to provide real-time service information.
Explore GPS tracking and automatic service assignmentStart with your network
Let’s define a proof of concept on your transport network: validate the origin–destination matrix and the decisions it can support before extending the analysis to routes and fleet.
Leave your name and email: we’ll contact you to discuss this use case.
Your interest: Origin–destination matrix
More than 15 public transport operators in Italy have already chosen us.
Explore Flowy
Discover how sensors, data and the platform work together, and find answers to frequently asked questions.